 Often, our data comes to us in ways that are better for calculating than they are for reading. One example of this is a standard data table that repeats headers and labels for each row. When we are sorting, alphabetizing, and filtering, this format is incredibly useful. However, when we want to read a summary of the information, these tables are difficult to work with. Sometimes, it is better to have all the options in a table listed in a comma-separated list rather than broken out across many rows. Unfortunately, Excel doesn’t have a simple function to make this possible. Here is a quick set of data manipulation steps that will build a comma-separated list in a single cell from multiple rows of data… Continue reading How to Combine (Concatenate) Data from Multiple Rows into One Cell
Category Archives: Tutorials
How to Do a Reverse String Search in Excel Using FIND
 Excel has some great functions available for working with long phrases (strings). It has RIGHT, LEFT, and TRIM to manage sub-strings. It also has FIND and SEARCH to look for specific characters or sub-strings inside a phrase. The only problem is that FIND and SEARCH look from left to right in a string. If you need to look for something starting at the end of a string, there isn’t a good tool built into Excel to do so. Fortunately, it is possible to build a formula to do just that – a reverse string search. Here’s how… Continue reading How to Do a Reverse String Search in Excel Using FIND
Extract a List of Values Filtered by Criteria with Sub-Arrays
 When you are working with large data sets, Excel’s built-in filters are a lifesaver, letting you get straight to the sub-set of data that you need. Sometimes, though, you need to be able to pull a set of data dynamically based on criteria that change. When the filter conditions change often, Excel’s filters fall short. Instead, there is a set of functions that can extract a data table from a larger data set based on specific criteria that you set. This tutorial will show you how to list values from a table based on filter criteria using sub-arrays and the SMALL function. Continue reading Extract a List of Values Filtered by Criteria with Sub-Arrays
VLOOKUP with Multiple Values or Criteria Using INDEX and MATCH (How To)
 VLOOKUP is a great tool for pulling data from tables, but it has a handicap: it can only work with one criteria for matching information. If there are multiple rows in your sheet with the same information, you’ll only get the first one. If you need to use two or more conditions to match a specific piece of data, you’re out of luck. Fortunately, Excel has a pair of functions called INDEX and MATCH that can help produce the same results as VLOOKUP with multiple criteria. Here’s a quick tutorial to help you learn how… Continue reading VLOOKUP with Multiple Values or Criteria Using INDEX and MATCH (How To)
How to Create Waterfall Charts in Excel
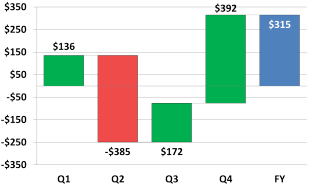 When you want to see how different parts of a total contribute to the final calculation, a waterfall chart (sometimes called a cascade chart or a bridge chart) can be a very useful visualization tool. Unfortunately, Excel doesn’t have a built-in waterfall chart option. With a bit of creativity, however, it’s possible to build one using a modified stacked bar chart. This tutorial will show you how to build your own waterfall chart, complete with different colors for positive and negative values and connecting lines… Continue reading How to Create Waterfall Charts in Excel
Make Your Own Custom Keyboard Shortcuts Using Macros
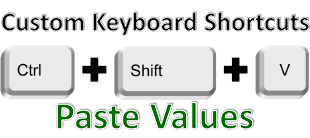 We all know that keyboard shortcuts are the fastest way to accomplish most tasks in Excel. I already showed you my top 10 keyboard shortcuts, and you can get a free quick reference for them when you join the newsletter. Unfortunately, not every common action in Excel has a keyboard hot-key assigned to it by default. Paste Values, for example, is one of the most common actions when formatting spreadsheets, but the only keyboard access for it is the cumbersome ALT+H+V+V through Excel Key Tips. Here, we’ll show you how to make your own custom keyboard shortcuts with macros by giving Paste Values the convenient CTRL+SHIFT+V it should have had all along… Continue reading Make Your Own Custom Keyboard Shortcuts Using Macros
Using Solver to Optimize Solutions to Costing Problems in Excel
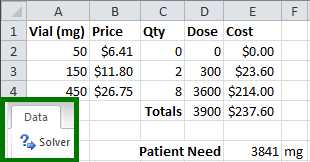 Imagine you’re faced with a purchasing problem… You need to buy some inventory that comes in multiple sizes. Bigger sizes come at a discount, which can save you money. Buy too much, it will be wasted, and that won’t save you money at all. This is a problem that would be very challenging to solve with basic IF statements and arithmetic formulas. Fortunately, Excel has an official Plug-in called Solver that can do amazing things to solve optimization problems like this. Let’s walk through an introduction to Solver and work through an example… Continue reading Using Solver to Optimize Solutions to Costing Problems in Excel
Calculating Week-To-Date, Month-To-Date, and Year-To-Date Using Helper Columns and SUMIFS
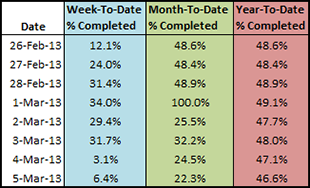 When you are working with date-stamped data imports, the volume of information can be overwhelming. It is difficult to tell, at a glance, whether performance indicators are trending upwards, downwards, speeding up, or slowing down. Aggregate statistics like Week-To-Date, Month-To-Date, and Year-To-Date performance data can often be easier to read and tell you more about what’s actually going on. Let’s learn how to implement X-To-Date aggregate statistics using helper columns, Excel date functions, and SUMIFS. Continue reading Calculating Week-To-Date, Month-To-Date, and Year-To-Date Using Helper Columns and SUMIFS
Building Charts with Multiple Series and Custom X-Axis
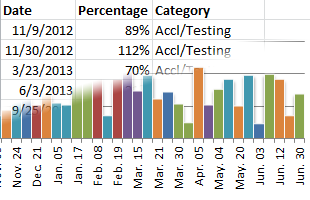 Here’s the drill… You’ve got a set of data dumped from some performance analytics database… It has a basic date series with some kind of output, and you need to put it into a chart that your executives can understand at a glance. Excel has an extremely powerful charting system, but it is not at all obvious or easy to use, particularly when you have a non-standard set of data. Odds are, your data is not set up the way Excel wants it to be, so you’ll have to do some leg work. Let’s walk through an example of data transformation and Excel charting… Continue reading Building Charts with Multiple Series and Custom X-Axis
How to Automatically Fill Out Forms using Data Validation and VLOOKUP
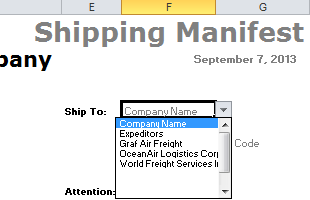 The business world is full of forms and paperwork built out of Excel spreadsheets. Even though the program isn’t designed for the task, the benefit of being able to calculate sums, totals, etc. in the form makes it the de facto standard for invoices, receipts, shipping manifests, and purchase orders everywhere. Often, you’ll find yourself using the same forms over and over again, so it makes sense to automate as much of the process of filling them out as possible. I’ll show you how to automatically fill addresses and contact information into a template shipping manifest… Continue reading How to Automatically Fill Out Forms using Data Validation and VLOOKUP